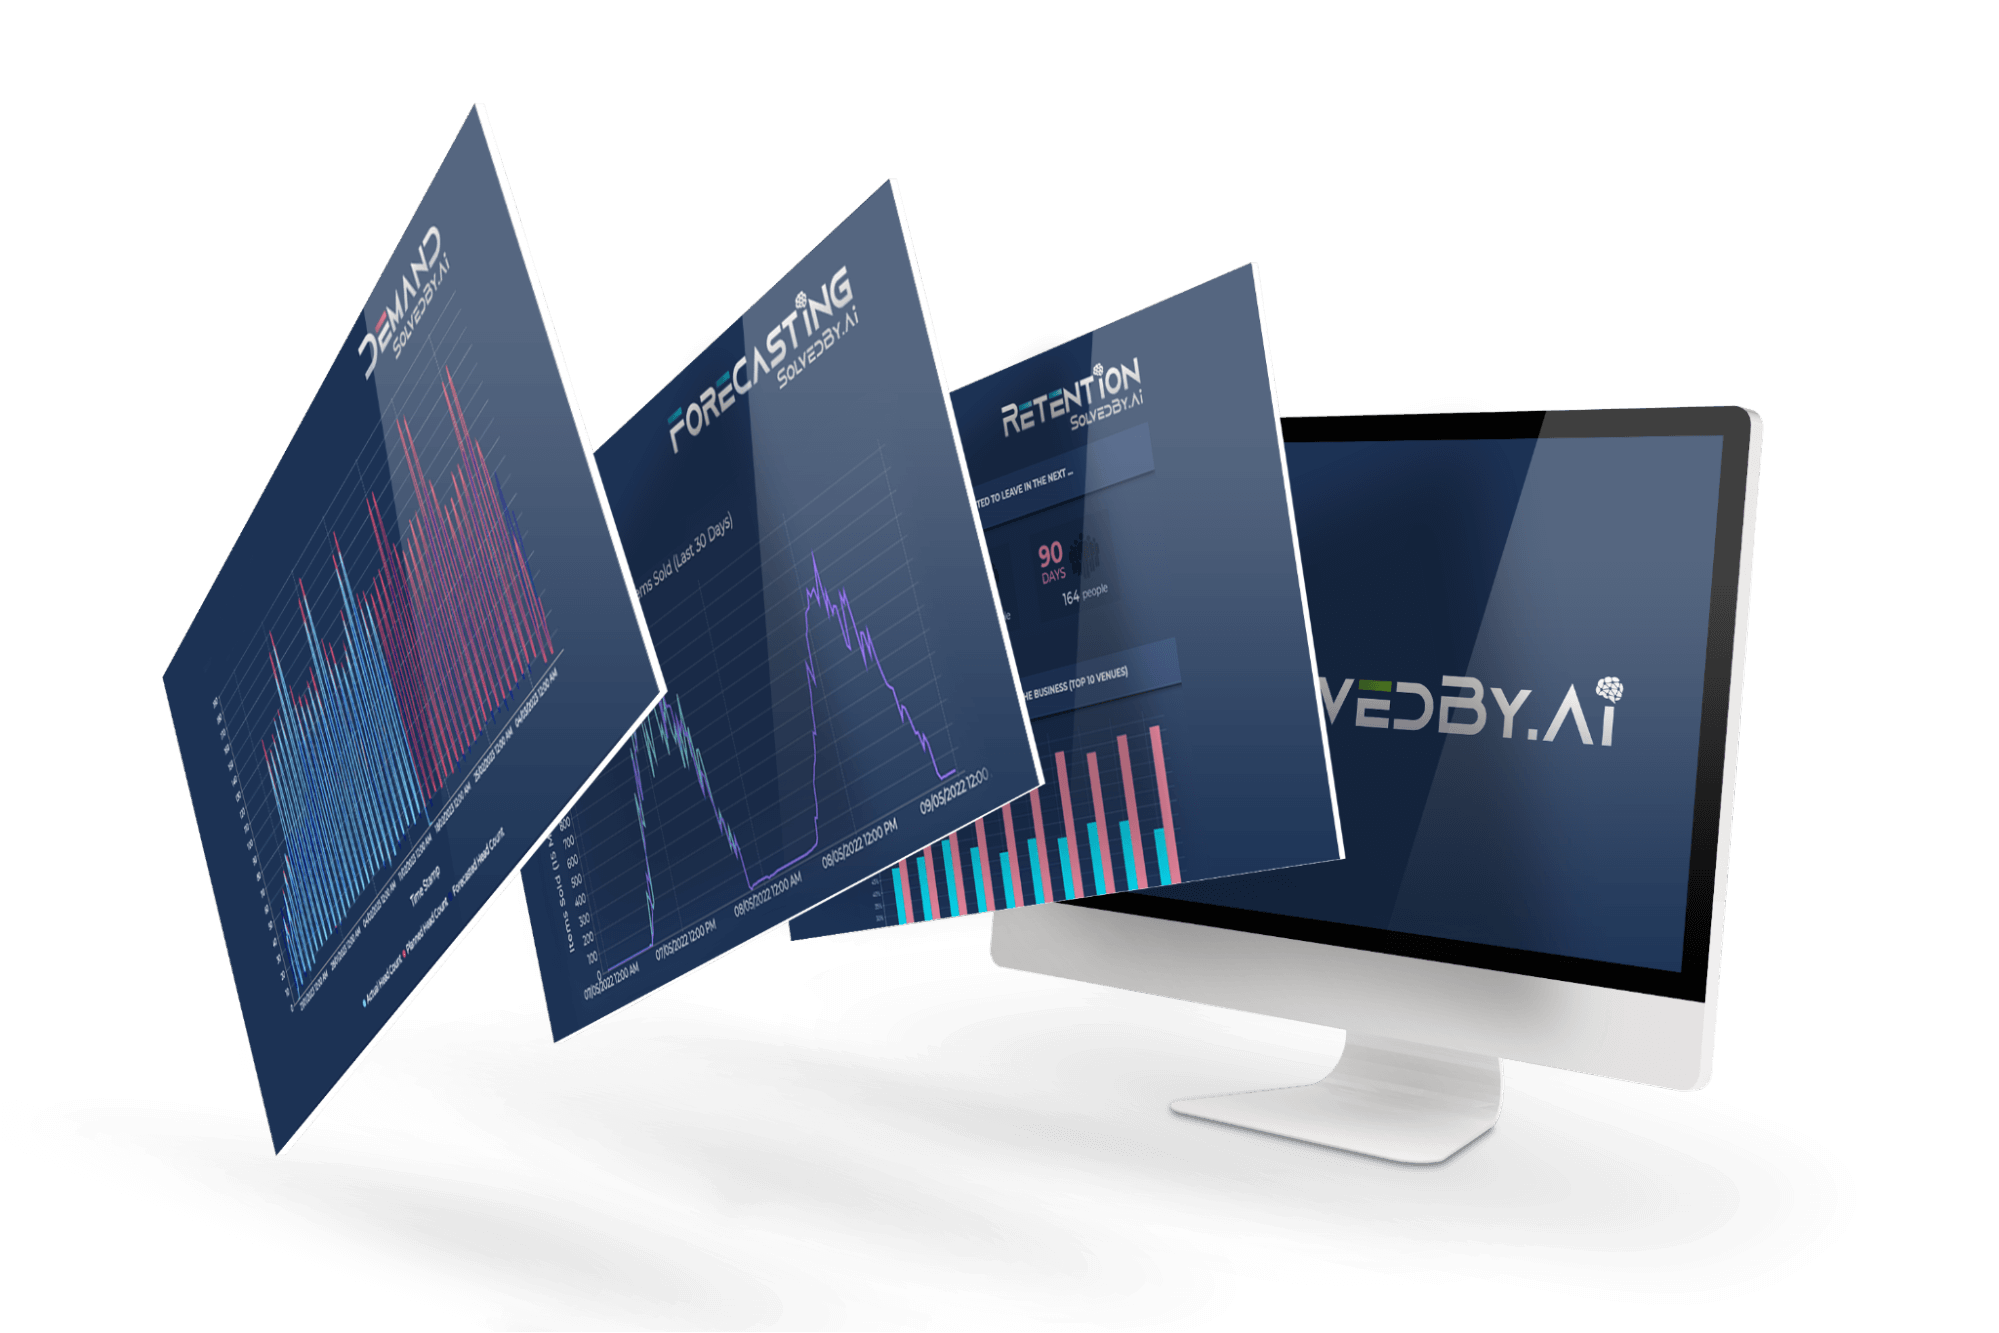
This forecasting glossary attempts to explain the jargon, acronyms, abbreviations and technical terms used in Artificial Intelligence-based forecasting. It provides an overview of the more commonly used terms and what they mean.
AI
Stands for Artificial Intelligence.
Algorithm
A set of precise steps, for the purpose of solving a particular issue or carrying out a calculation.
Analytics
A data-driven approach to improving business processes and products can be achieved through analytics.
Auto-Regressive Integrated Moving Average (ARIMA)
A time series model that, when differenced, follows an ARMA (AutoRegressive Moving Average) model. This type of model is often used to forecast future values of a time series.
Autoregressive Moving Average (ARMA) model
Is a type of time series forecasting that combines Autoregressive (AR) and Moving Average (MA) elements. This model expresses the series to be forecast as a function of both previous values of the series (AR terms) and previous errors resulting from forecasting (MA terms).
Artificial intelligence
The development of computer systems, able to carry out tasks that would usually need human intelligence, such as making decisions, recognising images, solving planning issues, translating and more.
Autocorrelation
Relation of values of the same time series at different time intervals is called autocorrelation. It is similar to the correlation between two different series, but in autocorrelation, the same series at different lags is used. Therefore, there can be an autocorrelation for a lag of 1, one for a lag of 2, and so on.
Autoregressive (AR) model
A type of regression in which the forecasted variable is related to its own past values at various time lags. The predicted value is expressed as a function of the previous values of the time series.
Backcasting
A technique used in quantitative forecasting where past errors are used to calculate starting values. This is done by taking the forecasting method and running it in reverse, beginning at the end of the data and going back to the start. This process is called backcasting, and the calculated starting values can then be used to apply the forecasting method to the standard sequence.
Box-Jenkins methodology
Developed by George E. Box and Gwilym M. Jenkins in the 1930s, gained popularity after they published a book in 1970 describing it in detail. This method encourages the application of autoregressive/moving average models to time series forecasting and analysis, and is now commonly known as the Box-Jenkins approach.
Chi-square test
Given a standard normal population (mean zero, variance one) and n values independently sampled, the sum of the squares of those sampled values is known as a chi-square with n degrees of freedom. This complete set of such values is referred to as a chi-square distribution.
Correlation Coefficient
A standardized measure of the relationship between two variables, X and Y. It ranges from -1 to +1, showing a strong negative, no, or strong positive relationship between the two variables. This value is calculated by taking the covariance between the two standardized variables. (often represented by the letter ‘r’)
Cross-Correlation
A measure of the relationship between two-time series, typically evaluated by comparing one series with the past, current, and future values of the other. This statistic has the same characteristics as a correlation coefficient, and is commonly used in the Box-Jenkins method to fit dynamic regression models.
Cumulative forecasting
predicting the total level of a variable over multiple time periods, rather than forecasting individual values for each period. For example, one could forecast cumulative sales for the coming 12 months instead of predicting a separate value for each month.
Data Mining
A field of science aimed at discovering relations in data.
Demand forecasting
Forecasting future customer demand and determining the necessary staff to serve them can be achieved through various methods.
Double moving average
When the average of a set of data, which has already been averaged, is taken again. This technique provides more smoothing or eliminates more randomness than an equal-length single moving average.
Dynamic regression model
A model that enables lagged values of explanatory variables to be included. It uses a transfer function to estimate the relationship between the forecast and explanatory variables. This model is used to forecast what will occur if the explanatory variable changes and the errors are often represented by an ARIMA model. Therefore, a dynamic regression with ARIMA errors is a special type of dynamic regression.
Error cost function
An expression of the cost of a mistake as a function of its magnitude, typically in the form of a quadratic equation, which suggests that the impact of an error is proportional to the square of the error.
Staff Forecasting
Prediction of variables such as sales and call volume, which have a strong connection with staffing levels.
Heuristic
A process that employs a trial-and-error method in order to reach a desired goal. It involves trying different techniques or strategies in order to find the best solution.
Holt-Winters’ method
An extension of Holt’s exponential smoothing technique developed by winters. It introduces an additional equation that takes into account seasonality. This type of exponential smoothing is capable of addressing data sets that contain both trend and seasonal components. It applies three smoothing parameters to regulate the level, trend, and seasonality.
Interdependence
Two or more variables which are interdependent show that their values are linked in some specific way. A change in the value of one of the variables will result in a corresponding change in the value of the other.
Labour Demand
The estimated number of hours required for each role in each department/store for a given time period.
Labour demand curve
Sometimes referred to as intraday workload distribution, is used to create a schedule based on predicted demand.
Labour Standards Software
A tool to construct and sustain a labour model, typically by capturing and documenting all of an organisation’s labour requirements.
Labour Standard
The duration of a worker’s completion of a particular task or activity.
M3-IJF Competition
A Competition was conducted in 1997 by the International Journal of Forecasting to compare a range of forecasting techniques using a standard time series.
Mean Absolute Percentage Error (MAPE)
Is a measure of accuracy that takes the average of the sum of the absolute percentage errors for a given set of data. It is a commonly used tool in forecasting.
Mean Percentage Error (MPE)
Calculated by taking the average of the percentage errors for a given data set. This average permits positive and negative percentage errors to offset each other, making it a useful measure of bias when assessing forecasting methods.
Mean Squared Error (MSE)
A measure of accuracy that calculates the average of the squares of the errors for each item in the data set. This gives greater emphasis to larger errors, as they are squared before being summed.
Machine Learning
Development of computer systems which learn and adapt without following explicit instructions,
ML
Stands for machine learning.
Machine Learning, Development Operations (ML OPs)
Refers to the Development Operations (DevOps) processes that are required to deploy and maintain machine learning models in production.
Multivariate ARMA model
Enables the forecasting of multiple time series that are interrelated. Each series is projected using a combination of its own past values, the past values of the other series, and past errors.
Neural networks
Mathematical models that resemble the workings of the brain. They consist of layers of neuron-like units, and when used for time series analysis, they offer a non-linear forecasting approach.
Operating model
A documented model which explains what staff are required to operate within a team and what variables might change that staffing level.
Operations Research (OR)
The use of mathematical models to improve business operations.
Probability
The likelihood of something happening is represented as a number between 0 and 1; an event with no chance of occurring has a probability of 0.
Random walk
A time series process that assumes each successive observation is equal to the preceding one plus some random noise.
Regression analysis
A technique to explore the connection between variables. These variables are generally classified as dependent or independent. An independent variable is a factor, input or driver that influences a dependent variable (or output).
Reinforcement learning
Enables an AI system to acquire knowledge and develop skills through a process of trials and errors, with feedback from its actions being used to guide and inform its progress. This feedback is typically provided in the form of a scoring system that rewards positive outcomes.
Resource Management
The process of effective and efficient utilisation of staff hours or other resources.
Seasonality
Regular fluctuations that take place at intervals of less than a year, for example, on a weekly, monthly or quarterly basis, are known as seasonality.
Smoothing
Estimating a continuous trend through weighted averages of observations is known as smoothing. This method of smoothing reduces randomness by allowing positive and negative fluctuations to partially cancel each other out.
Standard Deviation
A measure of how spread out the data is in comparison to the mean. When the standard deviation is low, the data is close to the mean, whereas when it is high, the data is more dispersed.
Supervised learning
Is a subcategory of machine learning where the data has to be labelled or tagged before an algorithm can be trained to classify data or predict outcomes accurately.
Time series
A sequence of values of a variable, taken at regular intervals in time, is known as a time series.
Time series forecasting
Using a model to predict future values based on past values, errors, and other related time series.
Unstructured data
A collection of varied data that are stored in native formats such as text, video or audio.
Unsupervised learning
A type of algorithm that learns patterns from untagged data.
Year on year (YOY)
A simple model based on taking last years actual data and applying a simple multiplication such as the average growth rate in the year to provide an estimate of this years sales.