We have previously talked about AI-powered forecasting, but how do we measure the accuracy of it? As we step further into the digital age, businesses in various sectors, including Retail, Leisure, Hospitality, Food Production, and Manufacturing, are increasingly turning to Artificial Intelligence (AI) to optimize operations and improve decision-making. One notable area where AI has made significant inroads is in forecasting. Predicting demand, stock levels, or even footfall can give businesses a competitive edge.
However, if you are considering implementing an AI-powered forecasting tool, how do you compare how accurate it is compared to your existing methods of forecasting?
What am I comparing when it comes to AI-powered Forecasts?
To generate a comparison, you first need to generate a forecast and plot it against what actually happened. You will need to do the same with your existing methods, so you have a basis for comparison. The graphical representation of a forecast should look something like this:
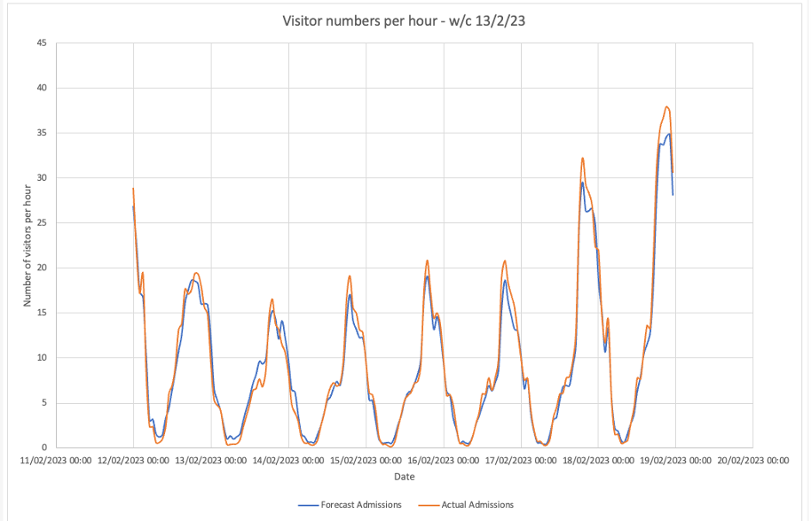
If you are thinking of buying software to replace existing forecasting methods, you should ideally have a trial to compare the two predictions.
The graphical display will often make it clear which is more accurate if one method is much better. However, you will want to use a more statistical approach if they are closely matched.
Top statistical methods for comparing two forecasts:
Here are some of the best ways of measuring the accuracy of a forecasting method.
Mean Absolute Percentage Error (MAPE)
What is it?
MAPE calculates the average of the absolute percentage errors between the forecasted and actual values. It’s a widely-used measure as it provides results in a percentage, making it easy for business managers to understand.
Why use it?
This is especially beneficial for sectors like Retail and Food Production, where percentages can quickly communicate the magnitude of forecasting inaccuracies, potentially affecting stock levels or perishable goods.
Root Mean Square Error (RMSE)
What is it?
RMSE computes the square root of the average of the squared differences between forecasted and actual values. The benefit of squaring the differences is that it gives more weight to significant errors.
Why use it?
This metric is crucial for businesses where larger forecasting errors can be particularly harmful. For instance, a significant misjudgment in demand could lead to costly overproduction or stock shortages in manufacturing.
Mean Absolute Error (MAE)
What is it?
MAE calculates the average of the absolute differences between the predicted and actual values. It offers a straightforward view of forecasting accuracy.
Why use it?
This is especially relevant in staffing decisions where understanding the average deviation from the actual can help understand how many people short or over you predict on average.
Bias
What is it?
Bias measures whether forecasts consistently overestimate or underestimate actual values. A positive bias indicates regular overestimation, while a negative one indicates underestimation.
Why use it?
It is especially valuable for sectors like Food Production. A consistent bias might mean the forecast system is inherently leaning one way, which could lead to regular overproduction (positive bias) or regular shortages (negative bias).

Coefficient of Determination (R²)
What is it?
R² signifies how well the model will likely predict future outcomes. An R² value of 1 means a perfect prediction, while 0 indicates no predictive power.
Why use it?
This method is universally beneficial. A high R² value can instil confidence in the AI system’s ability to forecast effectively, regardless of the business sector.
Conclusion
In an age where AI is reshaping how businesses function, it’s not just about having the latest technology but ensuring that it works for you. By understanding and applying these statistical measures, business owners and managers can ensure they’re making data-driven decisions that lead to real-world benefits.
Remember, an AI-powered forecast is only as good as its accuracy. Equip yourself with the proper knowledge to measure and, if necessary, improve this accuracy, ensuring that your business is always one step ahead.
Related posts